Overview of business reports
Use Gatekeeper reports to review engagement and fraud metrics in real time. To open the reports, click the chart icon on the navigation toolbar. The system opens the reports in a separate browser tab and authenticate you with SSO. The dashboard shows the fraudster and person identifiers in clear text. Click the identifiers to view the fraudster or person details.
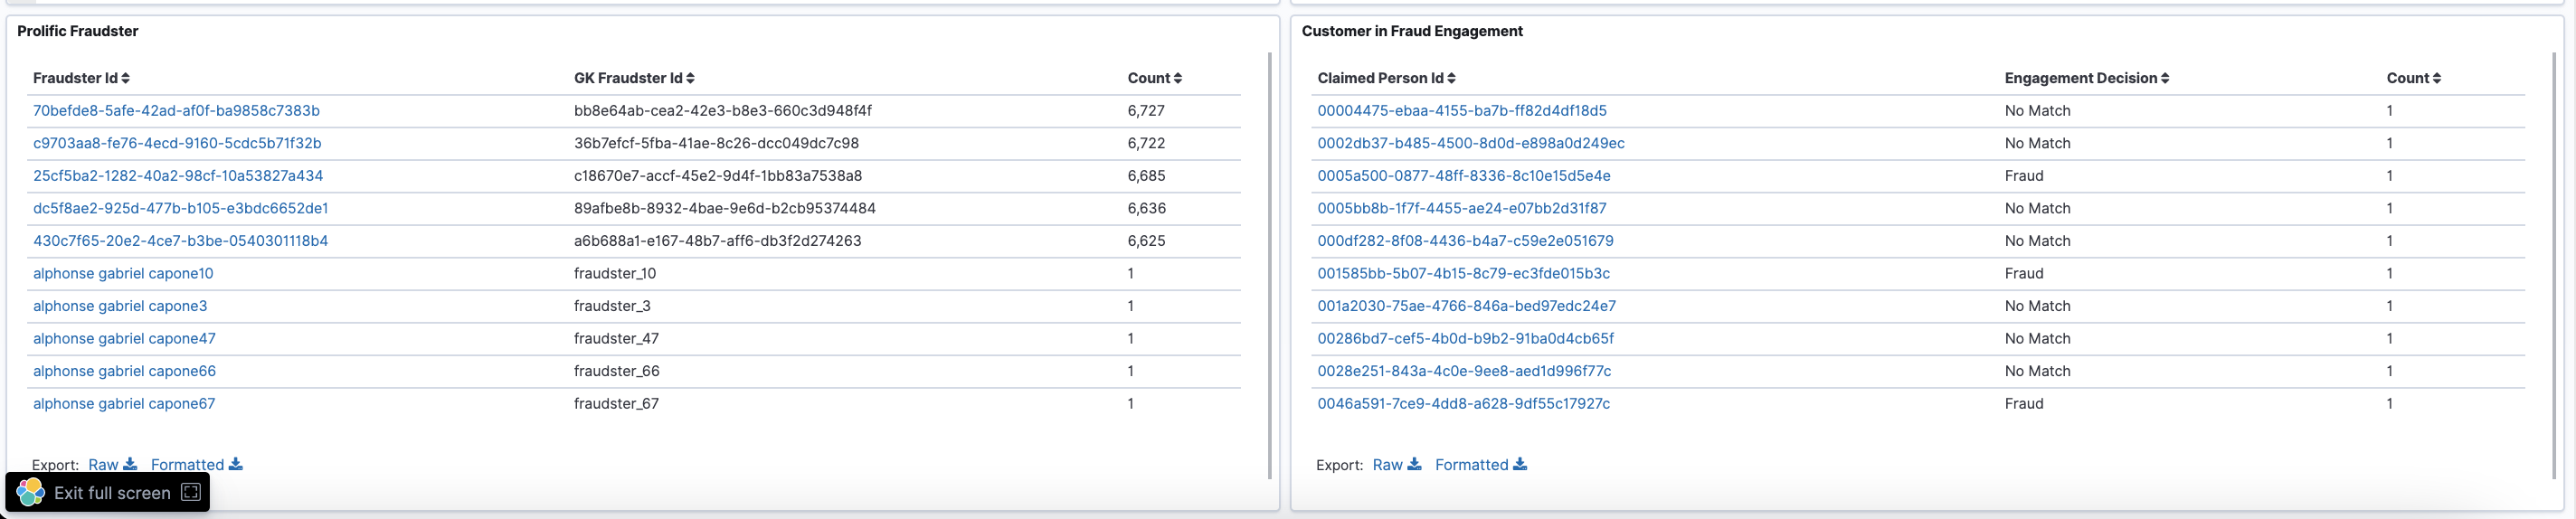
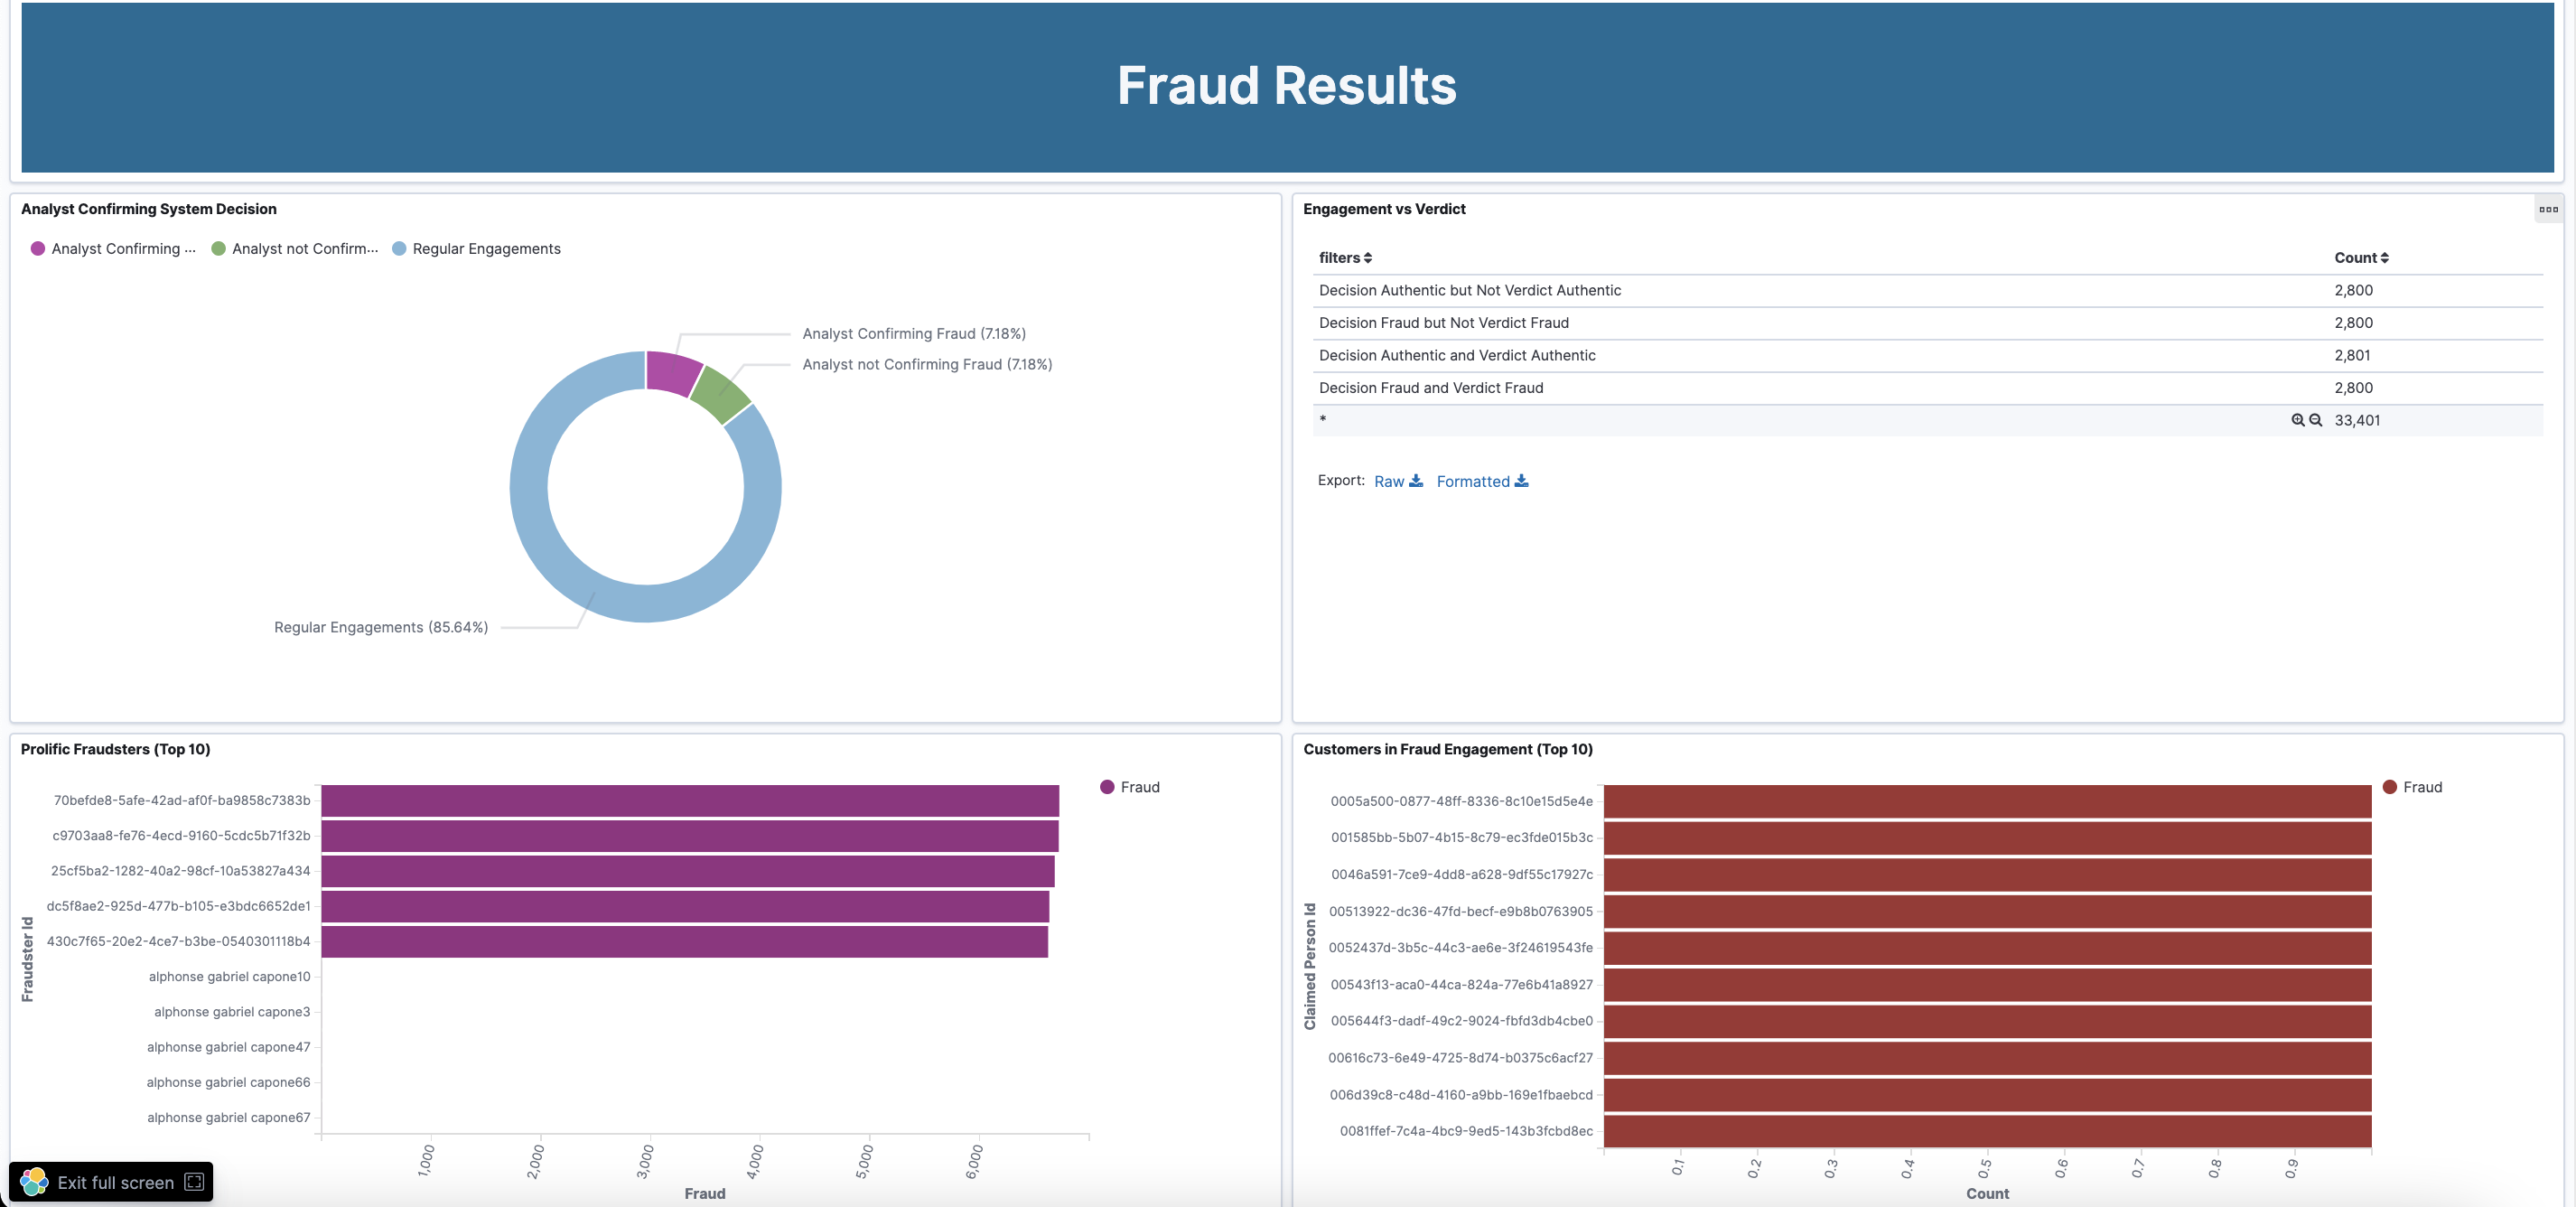
Click the three dots at the top right of any widget to open its action menu. Click Explore underlying data to access all documents used to create the visual chart. Click inspect to export raw or formatted data to a CSV file. (For charts using tabular format, click export in the widget itself.)
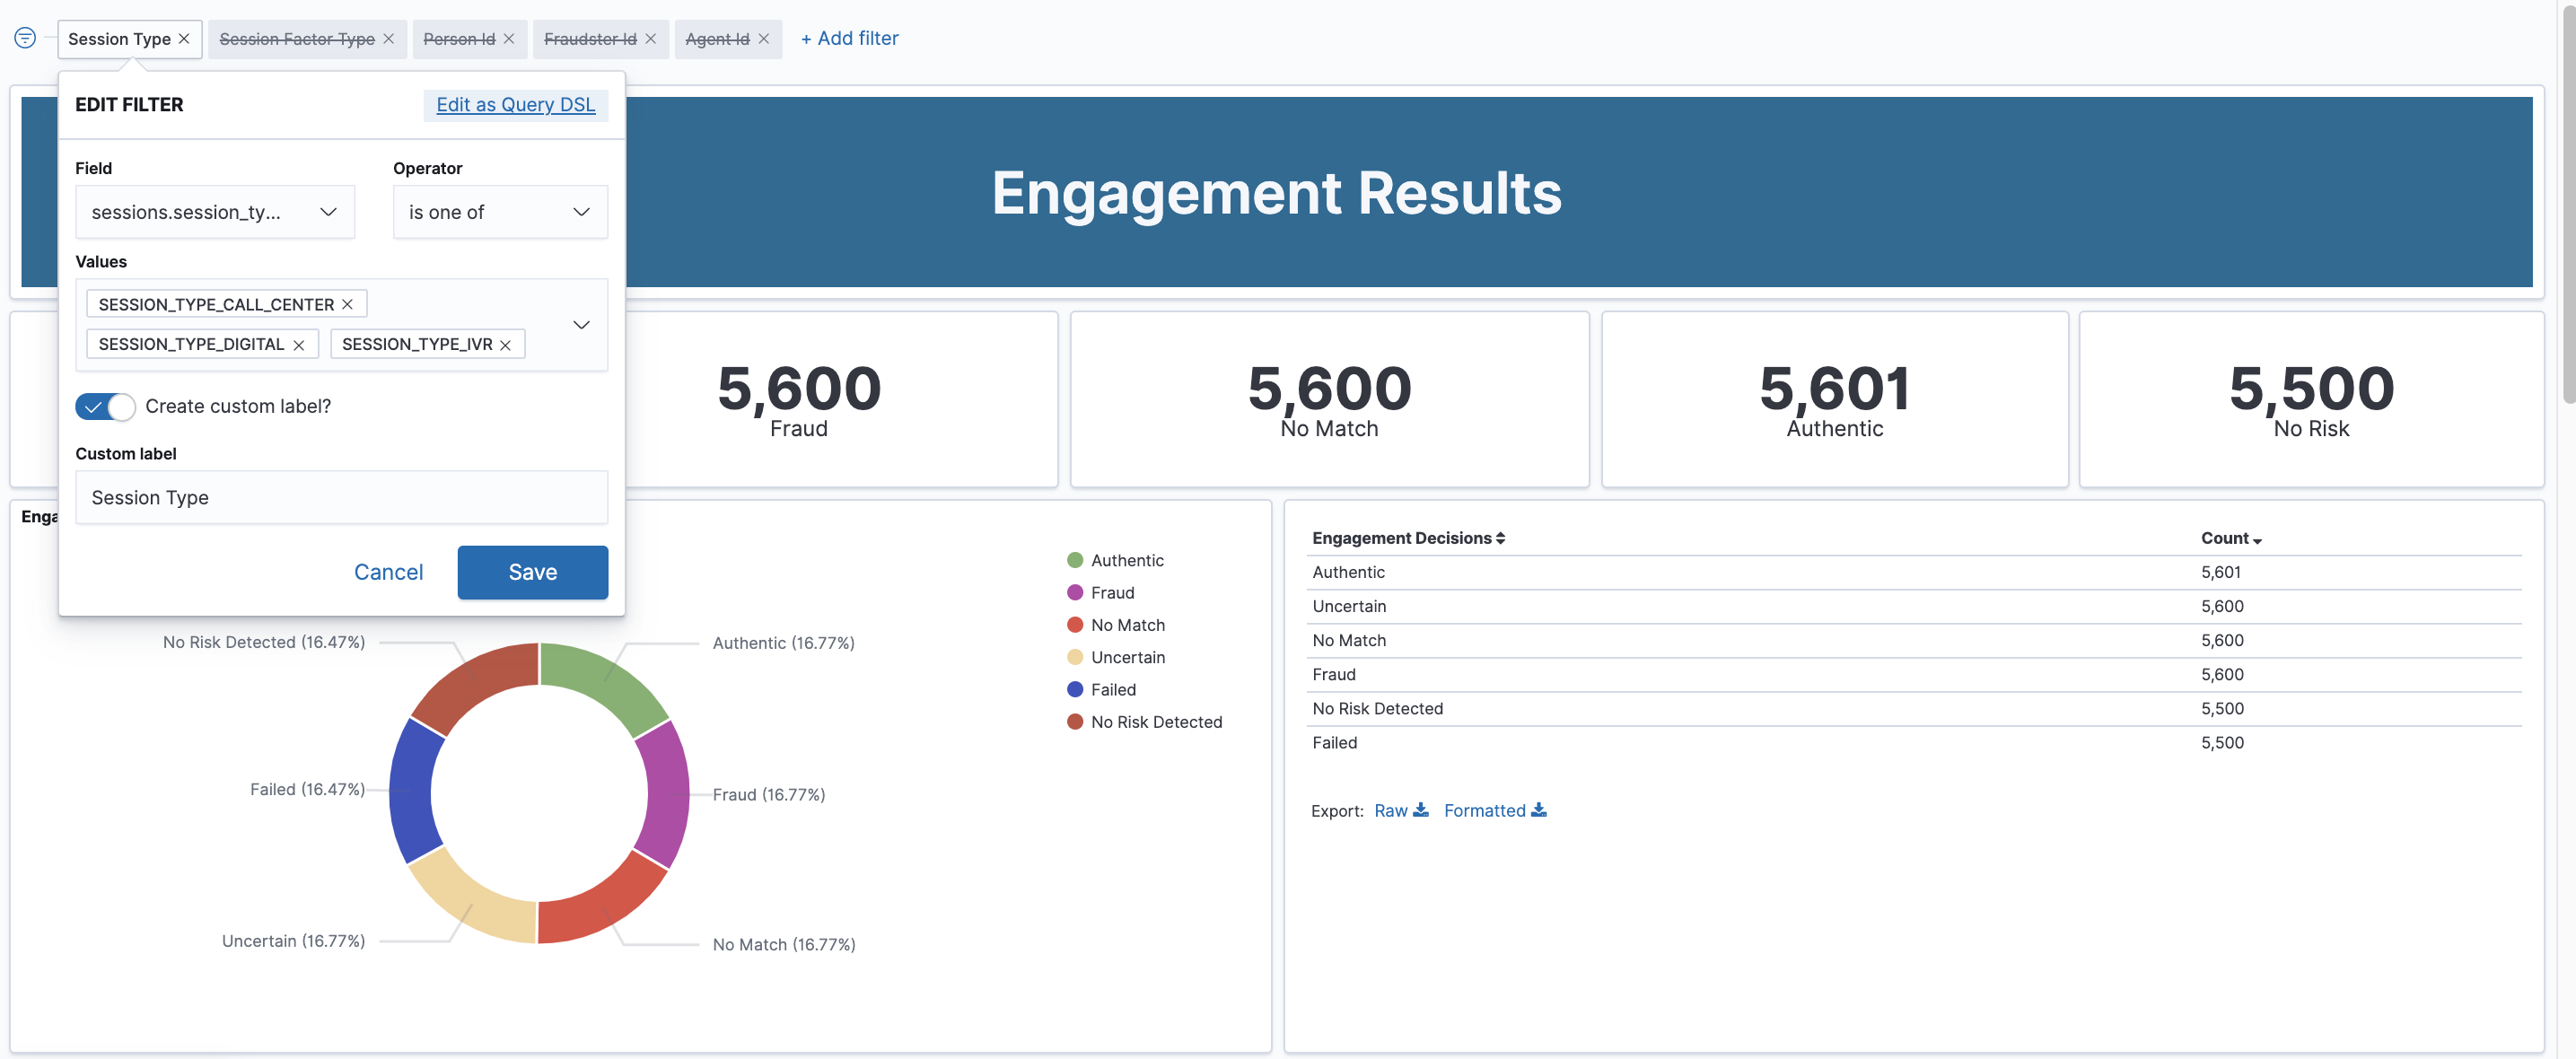
Use one of the following methods to filter the data displayed in the charts:
- The time range filter.
- A query written in the Kibana query language (KQL).
- Pre-defined custom filters that can be enabled or disabled on demand.
The deployment comes with out-of-the-box dashboards (described below). In case you want to build a custom reporting mechanism, export the raw audit information event and build your tailored ETL and visualization.
The following table compares custom and out-of-the-box reports:
| Category | Out-of-the-box reports | Custom reports |
|---|---|---|
| Usage method | Interactive | Programmatic |
| Format | Kibana style visualization | Json data structure |
| Time delay | Real Time | Real Time |
| Anonymized sensitive information | No | With and without anonymized info (based on authorization) |
| Access control | Different users or roles can be configured to access the Scope dashboard | Principals who can execute ExportRecords APIs |
| Predefined content | Yes | Multiple record types |
| Custom content | No | Customer can build their ETL and visualization from raw data |
| Retention | 12 months | Data retention of already exported data is controlled by the customer |